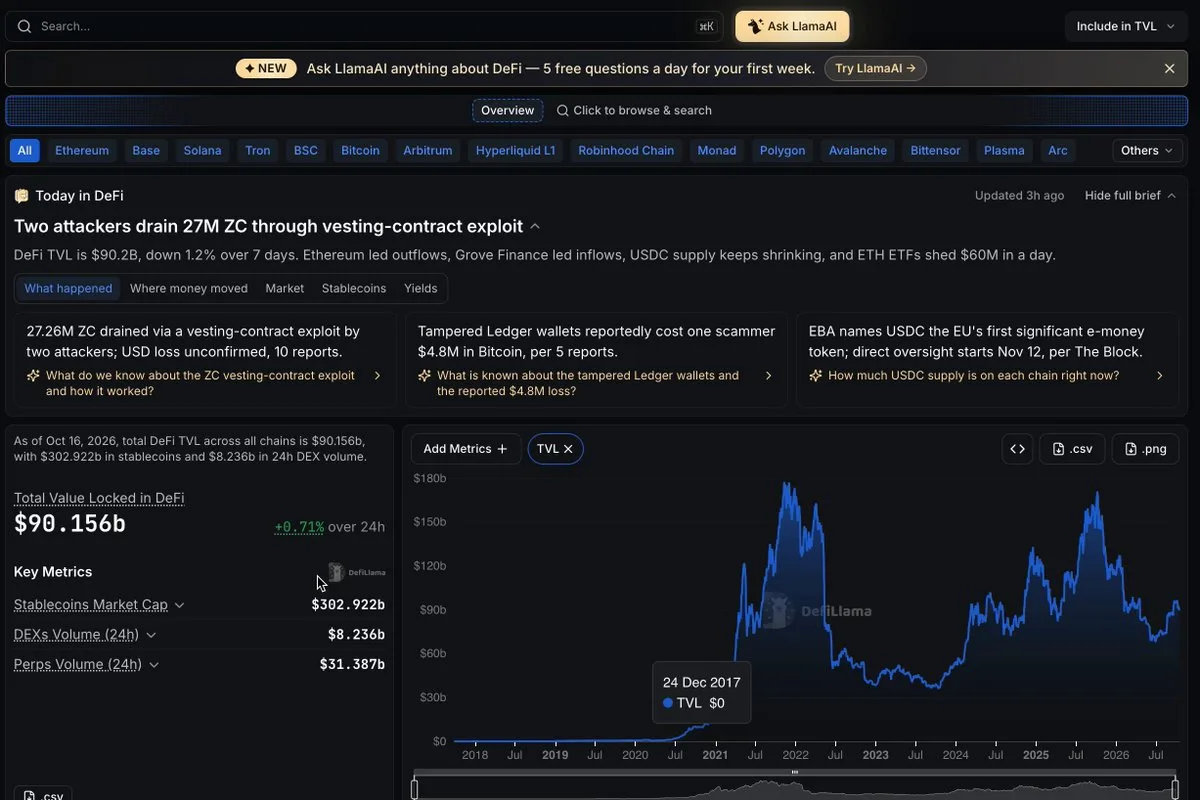
今天DeFi发生了什么?资金流向了哪里?市场、稳定币和收益率的最新数据如何? LlamaAI利用DefiLlama的链上数据,在我们首页生成一份“今日DeFi”更新,回答以上所有问题。
机器翻译


博主雷达 / @defillama
@defillama
粉丝 37万关注 4最近同步 10/19 09:44雷达库已收录
DefiLlama 官方账号 · DefiLlama
去 X 主页数据积累中
今天DeFi发生了什么?资金流向了哪里?市场、稳定币和收益率的最新数据如何? LlamaAI利用DefiLlama的链上数据,在我们首页生成一份“今日DeFi”更新,回答以上所有问题。
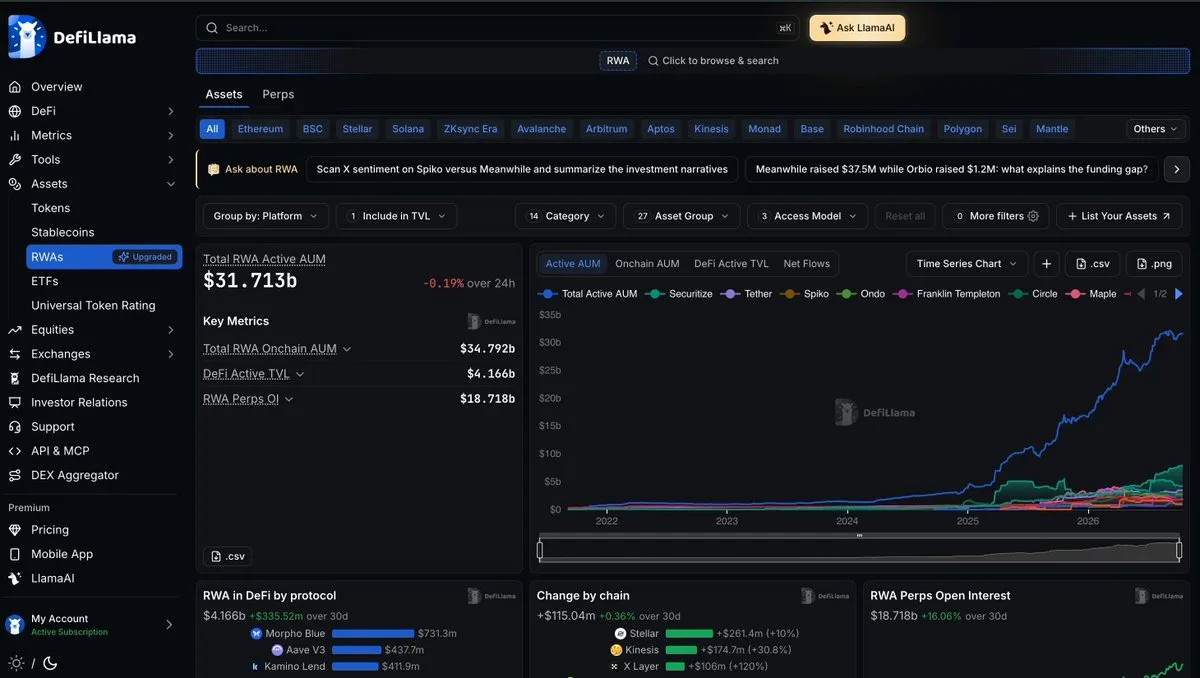
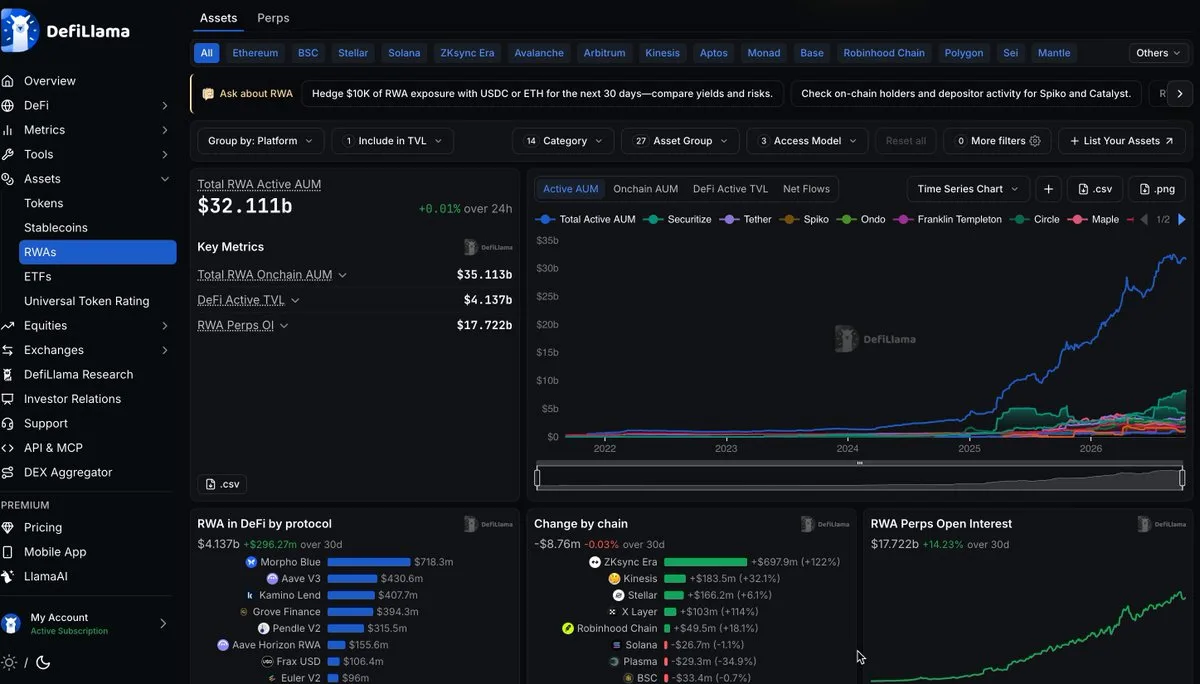
DefiLlama 的 RWA 仪表盘最近升级了: - 重做了 Perps 页面 - 导航更顺手 - 一眼能看到更多数据 - 加载更快 自己来看看吧:defillama.com/rwa
财报季即将迎来高峰: 下周有 10 万亿美元市值公布财报。 再下一周是 35 万亿美元。 数据来源:DefiLlama Equities 仪表盘
These were the top 10 DeFi protocols by revenue over the past 7 days. In total, these protocols brought in over $80M in weekly revenue.
14,985 yield pools is a lot to sort through. That's why our yield dashboard includes preset filters like "High Yield", "Safe Haven" and "Verified". The below thread dives into the high yield side.
Last week, we shared some tips to help you navigate @DefiLlama's yield dashboard more easily. Today, we explore the "High Yield" filter: audited pools with more than $1M TVL and 10%+ APY. 🧵⬇️
查看被引用的帖子我们的 Yields API 已上线 v2 版本。这次带来了 Verified APY、10 分钟刷新、借贷路由,以及其他一些新功能。 旧版 v1 接口将在一个月后正式弃用。
DefiLlama 的 RWA 页面最近升级了。 可以按平台、链、资产组或类别对资产进行分组,新的图表让你一眼就能看出是什么在推动 RWA 板块。 如果你有阵子没看了,值得重新看一眼。
你可以用下面这段 LlamaAI 提示词自己生成这份分析和图表: 为 DefiLlama 追踪的所有协议构建一个“费用到持币者收入增长”的漏斗,使用当前数据。 粒度和范围 - 使用父协议粒度(每个协议一行)。第 1 阶段是所有被追踪协议的数量。 漏斗阶段(报告每个阶段的数量、相较上一阶段的流失,以及保留百分比): 1. 所有被追踪的协议 2. 过去 30 天费用非零 3. 过去 30 天收入非零 4. 过去 30 天持币者收入 > 0(“将收入传递给代币持有者”) 5. 在第 4 阶段中,持币者收入在过去 90 天或过去 365 天相较上一周期增长 6. 在第 4 阶段中,持币者收入在 90 天和 365 天两个窗口都增长 7. 在第 6 阶段中,同时满足 30 天收入 >= $100K 且市值 > $1M 规则 - 增长 = 预先计算好的持币者收入窗口变化(90 天和 365 天相较此前等长周期)。增长意味着 > 0。增长数据缺失的协议不计为增长;报告有多少缺失。 - 在单次查询中对不同协议计算所有数量,并在代码中计算流失和保留百分比,不要手工计算。 - 另外报告以下背景信息:在没有任何增长筛选的情况下通过两个门槛的数量、这些数量背后有多少行是过期的(2 天以上未刷新),以及有多少第 6 阶段协议因收入或市值缺失而在第 7 阶段被剔除。 最终表格(第 7 阶段协议) - 列:协议(带链接)、30 天收入、30 天持币者收入、市值、90 天和 365 天持币者收入增长,以及 90 天和 365 天总收入增长。 - 按 30 天持币者收入降序排序。 - 标记任何总收入在任一窗口萎缩、但持币者收入仍在增长的协议。 交付物 1. 一张漏斗图(一张信息图,横向 1536x1024):左侧是漏斗条,带数量、条之间的流失和保留百分比;右侧是最终表格。嵌入查询得到的精确数值。注明条形宽度并非按比例绘制。页脚:“Source: DefiLlama” 加上日期。 2. 生成后,查看图片,并对照查询结果核验每一个数字。如有任何错误,更正并重新生成。 3. 一段简短书面总结:最大流失点、最终分组的集中度,以及注意事项(增长数据缺失、过期行、持币者收入由适配器方法论定义、最终数量是下限)。 最后写上数据截至日期和来源。
Of 6,567 protocols tracked on @DefiLlama: 1,490 collect nonzero fees. 1,252 have nonzero revenue. 264 have nonzero holders revenue. 119 have growing holders revenue over 90d or 365d. 25 have growing holders revenue in both 90d and 365d. 12 of those have revenue over $100K/mo and market caps over $1M.
查看被引用的帖子我们设计 LlamaSearch 就是为了解决这个问题。 它不能完全取代 Google,但加密原生用户可以在这里找到数千个加密项目、应用和网站的已验证链接。 search.defillama.com/
你最近试过在 @llama 上问加密货币的问题吗? 回答最近有改进,而且 llama 现在会直接在回复里带上图表。
Solana's app fee share stayed flat at roughly 91-95% over the past year, no steady climb up or down. It was 93.4% in Oct 2025, dipped to a low of 91.0% in Mar 2026, then hit 94.7% in Sep 2026. Chain fees (network) vs app fees (apps on Solana), DefiLlama data, Oct 2025 - Sep 2026, both charts attached. Top app fee categories (12mo avg share of category total): - DEXs 35.2% - Launchpads 15.0% - Liquid staking 11.5% - Trading apps 10.2% - Derivatives 5.7% Moves worth noting: - Launchpads rose from 10.0% to 20.3% - DEXs dipped near 30% in spring/summer, back to 43.0% by Sep 2026 - Liquid staking fell from 15.0% to 5.6% - Derivatives fell from 10.4% to 3.1% Category shares are approximate: the underlying rows overlap, so category sums run 9-25% above the chain-level app-fee total. On the 85% claim floating around: that Blockworks chart tracks revenue, not fees, with Solana's own share near 15-20% recently vs DefiLlama's chain-fee share of roughly 5-9%. Different definitions, but same direction, apps take the large majority. Data as of 2026-10-12. defillama.com/ai/chat/shared/0839a92b-5d4c-4847-a5cc-fc94a3f1c176
查看被引用的帖子